Get 10x Speedup in Tensorflow Multi-Task Learning using Python Multiprocessing
Background
Recently I started to model user search queries using Tensorflow. After some discussion with my team, the original problem boils down to a set of classification tasks, where each task is a multi-label classification problem. One interesting observation here is that the tasks are highly related: knowing the labels of one task could help one to guess the labels of another task. So perhaps it would be a good idea to train all those tasks in the same neural network simultaneously, hoping that the commonality across the tasks will be exploited during the learning and improve the final performance.
As the number of tasks increases, my training data becomes larger and larger. As a consequence, directly feeding such training data into Tensorflow’s session becomes laggy and results in poor GPU utilization. Moreover, it is vulnerable to memory leaks and can’t be used for days-long training. In this article, I will explain data feeding problems and design a much more efficient and robust input pipeline for days-long training. If you have ever struggled with Tensorflow’s multithread-based queue and frustrated by its low performance, then you should definitely give this multiprocess-based implementation a try.
This post was originally published when Tensorflow was at 1.1, in which data pipeline was still inmature. If you are using Tensorflow >=1.4, you may leverage the new Dataset API. It implements a similar idea as described in this post.
A Short Brief on Multi-Task RNN
The idea of jointly learning multiple goals is nothing new and has been well-studied in the machine learning community. Specifically, this problem is called the multi-task learning. Comparing to training the models separately, multi-task learning learns tasks in parallel while using a shared representation. By transferring knowledge across tasks via the shared representation, it can improve learning efficiency and prediction accuracy for the task-specific models. Interested readers are encouraged to read this post for a summary of state-of-art multi-task learning methods.
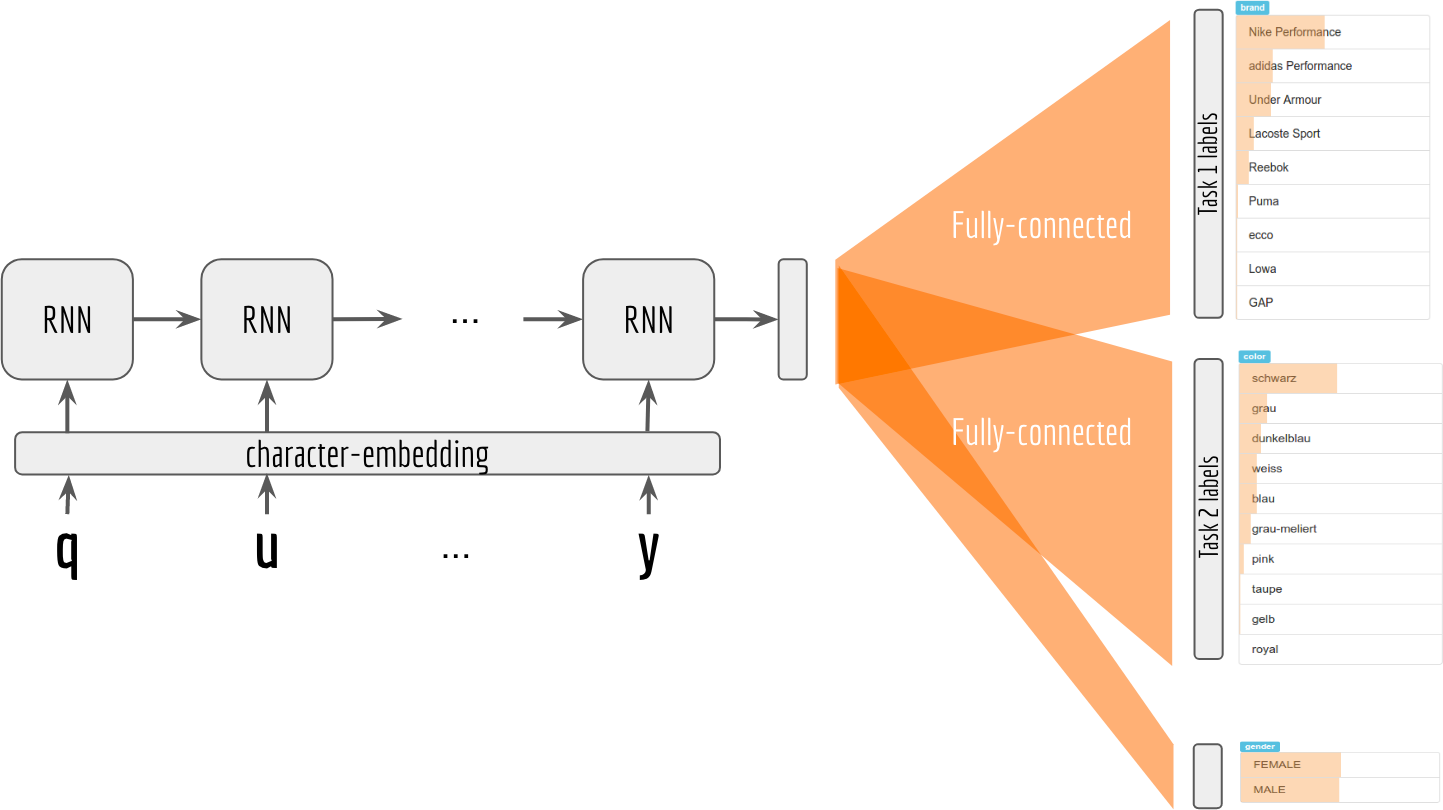
For employing multi-task learning on sequence data, I use recurrent neural networks as the backbone of the network. The structure of my multi-task RNN looks like as follows:

For the sake of clarity, I only draw a very basic version of my network here. One can certainly try different variants such as replacing RNN cell with LSTM and GRU cell, adding bidirectional or stacked RNN layer on top of the chain. What’s important here is that the final output of RNN chain should be shared by all task-specific fully connected layers, which are then followed by softmax layers to obtain the final label distribution on each task. This can be done via:
1 | Y_logit = { |
Given the logit output and groundtruth labels on each task, we can compute the task-specific cross-entropy loss and total cross entropy loss as follows:1
2
3
4
5
6
7task_loss = {
k: tf.reduce_mean(
tf.nn.softmax_cross_entropy_with_logits(
labels=Y_soft[k], logits=Y_logit[k]),
name='softmax_xentropy_' + k) for k in all_tasks.keys()}
total_loss = reduce(tf.add, task_loss.values())
At this point, there are at least two straightforward ways to solve this optimization problem.
- alternatively optimizing each task-specific loss, i.e.
task_loss[k]; - jointly optimizing
total_loss.
Which one outperforms the other usually depends on the training data. Note that, the first method does not require training data to be aligned across tasks, whereas in second method one needs labels of all tasks for every sequence in the batch. On the other hand, one can add adaptive weight on each task in the second method to obtain more task-sensitive learning. I choose the second method as we happen to have aligned training data. Plus, I want to explore adaptive weighting in the future.
Data Format and Preprocessing
Our data comes (almost) directly from the production system. Training data of each task is a JSON file and looks like this:
1st task: Animal’s type1
2
3
4
5
6
7
8
9
10
11
12
13
14[{
'query': 'cute',
'label': [
'CAT': 123,
'DOG': 23,
'SHEEP': 10,
...]},
{
'query': 'grassland',
'label': [
'SHEEP': 14,
'WOLF': 3,
...]}
]
2nd task: Animal’s color1
2
3
4
5
6
7
8
9
10
11
12
13
14[{
'query': 'cute',
'label': [
'PINK': 120,
'WHITE': 36,
...]},
{
'query': 'grasslands',
'label': [
'GREEN': 10,
'WHITE': 5,
'BEIGE': 1,
...]}
]
As I mentioned before, the good news is that data is aligned. Queries from different JSONs are sorted in the same order, which is perfect for the joint training method. However, we can not feed such JSON files directly to Tensorflow, preprocessing is required. Specifically, one needs to do the following steps before feeding the data to a Tensorflow session:
- bucketing and padding
queryfield so that each batch contains sequences in the same length; - transforming the content in
labelfield to a (sparse) labeling matrix; - normalizing the labeling matrix row-wise.
Some preprocessing steps (e.g. bucketing) can be done in advance, whereas others need to be done batch-wise especially when data is large. For example, building and normalizing labeling matrix of each batch.
A straightforward way is running batch generation and training procedure sequentially in the same process, such as:1
2
3
4
5
6
7
8
9
10
11
12while cur_epoch < MAX_EPOCH:
# do all preprocessing in `next_batch()`
train_data = next_batch(batch_size)
train_dict = {
X: train_data['queries'],
Y: train_data['sparse_label_matrix'],
L: train_data['query_lengths'],
}
# do actual training
sess.run(train_op, feed_dict=train_dict)
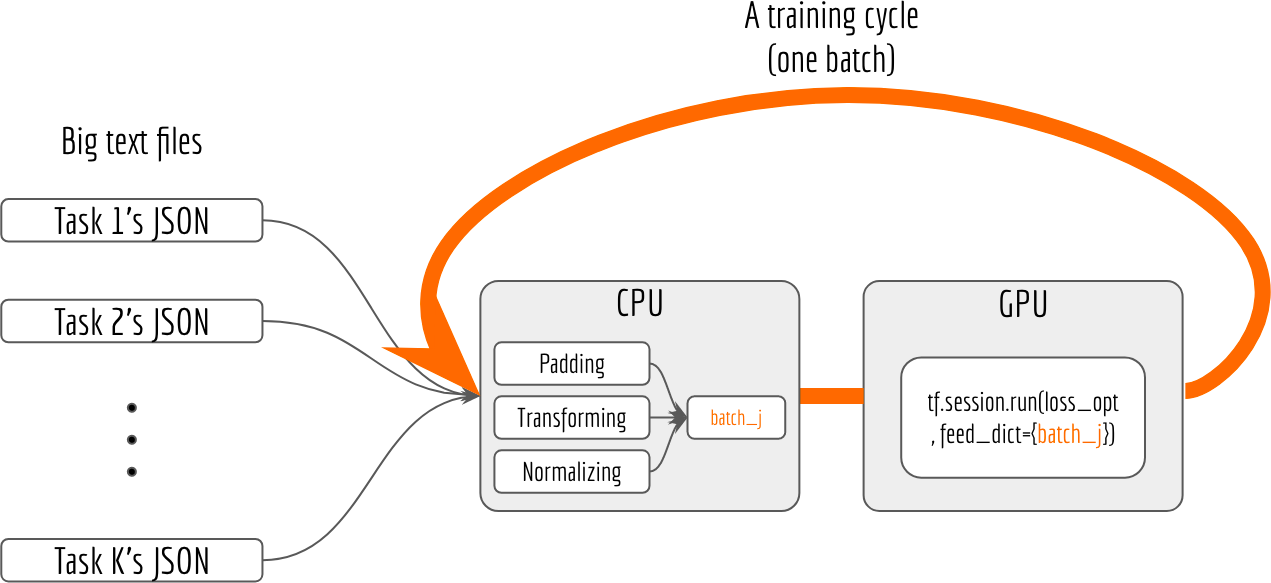
If we visualize the above code, the workflow looks like the following graph:

There are at least two problems of this workflow:
- low GPU utilization. GPU keeps idle until CPU finishes the batch preparation. Especially when the network is small and training takes less time than batch preparation, one can notice a significant lag between each training cycle. In order to keep GPU busy, one can increase the size of each batch, which unfortunately also increases the preparation time on CPU.
- vulnerable to memory leak. Larger models often require hours or days of training, it is very hard to guarantee all memory resources are correctly released during the whole training time (particularly in Python). At some point, the system won’t be able to allocate any memory for a new batch. As a consequence, the program crashes and you have to use checkpoints for recovery.
I have tested this implementation on a machine with a quad-core CPU and NVIDIA Tesla K80. The average GPU utilization is below 30% and only one CPU core is used. Increasing batch size only makes it worse.
Feeding Data More Efficiently and More Reliably
Having these problems in mind, I resort to Python multiprocessing package to introduce some asynchronous and parallel computation into the workflow. I’m aware that Tensorflow has a thread-based queue API already. Unfortunately, after hacking with it for one day, TF thread-based feeding pipeline still performs poorly in my case. In fact, it is even slower than the above naive implementation. Despite the bad performance of Python threading (due to Global Interpreter Lock), I also found several reports regarding the low performance of Tensorflow queue on stackoverflow and github. As I’m writing this blog post, there is an open discussion on github about redesigning TensorFlow’s input pipelines. Given that Tensorflow’s queue API may change in the next versions, I decide to build asynchronous queue by myself. Thanks to the multiprocessing package, implementation is very easy and straightforward.
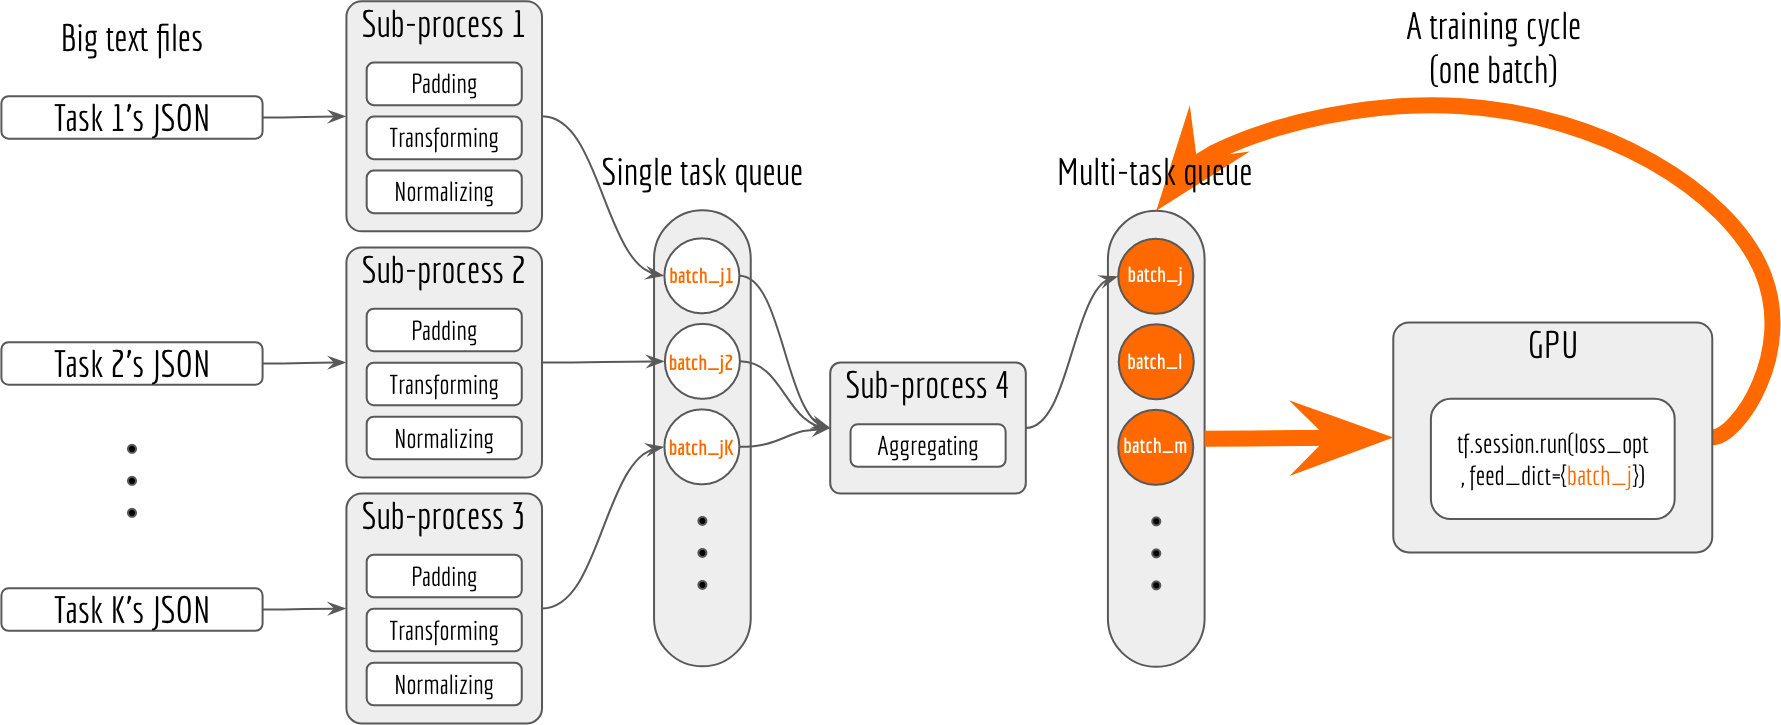
Here is an overview of my data feeding workflow. I will explain the ideas behind this graph later.

The main ideas are following:
- In the main process, I create two queues (via
multiprocessing.Queue): one is for storing task-specific batches, the other is for storing multi-task batches that are ready for feeding to Tensorflow. - I spawn multiple sub-processes (via
multiprocessing.Process), each process keeps preprocessing the JSON input and generating task-specific batch and putting the batch to the “single task queue”. - I spawn another sub-process for aggregating the task-specific batches, and putting the result to the “multi-task queue”.
- Whenever GPU needs a new batch for training, I directly get a batch from the “multi-task queue” and feed to
session.run(..., feed_dict=...). No more waiting. - When training ends I trigger a stop-event (via
multiprocessing.Event) to all sub-processes and gently terminate them. - I monitor the memory usage in the main process using
psutilpackage. Once the memory usage reaches some threshold, the main process will terminate all sub-processes and respawn them. The actual training session in the main process is not affected and can continue once respawn is finished. No more out-of-memory.
Here is a very basic implementation of those ideas. Again, my code is in Python 3 with type annotation.1
2
3
4
5
6
7
8
9
10
11
12
13
14
15
16
17
18
19
20
21
22
23
24
25
26
27
28
29
30
31
32
33
34
35
36
37
38
39
40
41
42
43
44
45
46
47
48
49
50
51
52
53
54
55
56
57
58
59
60
61
62
63
64
65
66
67from multiprocessing import Process, Queue, Event
class SingleBatchGenerator(Process):
def __init__(self, single_task_q: Queue, stop_event: Event):
super().__init__()
self.done_q = single_task_q
self.stop_event = stop_event
self.myseed = 0
# bucketing, padding sequences; and transforming, normalizing labelling matrix
def next_batch(self, seed: int):
pass
def run(self):
while not self.stop_event.is_set():
if not self.done_q.full():
self.done_q.put(self.next_batch(self.myseed))
class BatchAggregator(Process):
def __init__(self, single_task_q: Queue, multi_task_q: Queue, stop_event: Event):
super().__init__()
self.pending_q = single_task_q
self.done_q = multi_task_q
self.stop_event = stop_event
self.mt_batch = {}
# merge single task batches with same job seed to a multi-task batch
def merge_st_batches(self, st_batches: Dict[str, Any]):
pass
# check whether the multi-task batch contains all tasks
def is_complete(self, st_batches: Dict[str, Any]):
pass
def run(self):
while not self.stop_event.is_set():
if not self.done_q.full():
st_batch = self.pending_q.get()
job_task = st_batch['task_name']
job_seed = st_batch['myseed']
self.mt_batch[job_seed][job_task] = st_batch
if is_complete(self.mt_batch[job_seed]):
self.done_q.put(merge_st_batches(self.mt_batch.pop(job_seed)))
class MultiTaskBatchManager:
def __init__(self):
self.stop_event = Event()
self.single_task_q = Queue(MAX_CAPACITY)
self.multi_task_train_q = Queue(MAX_CAPACITY)
self.batch_aggregator = BatchAggregator(self.single_task_q, self.multi_task_train_q, self.stop_event)
self.batch_generator = {task: SingleBatchGenerator(self.single_task_q, self.stop_event) for task in all_tasks}
for w in self.batch_generator.values():
w.start()
self.batch_aggregator.start()
def next_batch(self):
return self.multi_task_train_q.get()
def close(self, timeout: int = 5):
self.stop_event.set()
for w in self.batch_generator.values():
w.join(timeout=timeout)
w.terminate()
self.batch_aggregator.join(timeout=timeout)
self.batch_aggregator.terminate()
I tested the new data feeding pipeline on the same machine with a quad-core CPU and NVIDIA Tesla K80. Setting the batch size to 5000, I’m able to reach on average 90% GPU utilization and 95% CPU utilization on all four cores. Needless to say, I’m very happy with this result. Efficient and reliable data feeding allows me to focus more on the model itself and explore more with large-scale data, which may reveal interesting patterns that otherwise won’t be significant or even observable.
Using Tensorflow for Preprocessing in Subprocess
In some cases such as image-related task, data preprocessing means much more than a simple normalization. Therefore one may need to build a computation graph for preprocessing as well. Luckily, adding Tensorflow sessions to our new data feeding pipeline is very straightforward. One can simply modify run() method in SingleBatchGenerator class as follows:
1 | def run(self): |
In this example, I open a TF session in each subprocess and restrict the computation to CPU-only via with tf.device("/cpu:0"). This will leave all GPU resource to main training procedure. When you use nvidia-smi to check the GPU status, you will find something similar to this:
Judging from the GPU memory usage, one can observe that only the main process (with PID: 9961) is running on GPU. All subprocesses (PID:10021 - 10046) are mainly on CPU. However, the reason that nvidia-smi still captures and shows those CPU processes isn’t very clear to me. Perhaps because of the implementation in tensorflow-gpu package.
Is Memory Leak a Real Problem?
Yes, it is. Some memory leaks are crafty and hard to notice if the training procedure only takes an hour. I can recall many times that my program crashes during the days-long training because of the memory issue. There are many places that memory leaks can happen, e.g. dict.pop() in Python 3.6 and tf.sparse_tensor_to_dense. But when it comes to training DNN with Tensorflow, memory leaks are more likely to hide in the data preprocessing and batch preparation steps.
The new data feeding pipeline is less prone to memory leaks. Not because it won’t generate any memory leak during preprocessing, but because it gives one better control by restricting the memory leaks to a subprocess. When the memory usage reaches some threshold, one can simply terminate all subprocesses and respawn them. The training procedure is separated in the main process, thus won’t be affected or interrupted. The only thing you might lose is seconds of training time while waiting respawned new subprocess ready. Nonetheless, such loss is nothing compared to an unexpected system crash.
Finally, I’m not saying you should leave memory leak as it is. Instead, you should actively diagnose it and fix it. I often use memory_profiler for monitoring memory consumption and diagnosing the problem. Its visualization feature is particularly helpful.